B
L
I
T
S
M
O
B
I
L
E
A
P
P
S
Assisting Businesses in gaining valuable insights from their data.
Our data analytics services assist in developing future data-driven systems and optimize the value of information. We use Microsoft Power BI or Tableau to build effective and useful analytics solutions that are tailored to each business. These tools transform your raw data into visual representations, providing you with crucial information about the state of your company, market trends, and future issues. We can assist you in making sense of your data so that you can reap the many advantages of data analytics.
We help organizations discover insights hidden in their data by utilizing the analytical capabilities of Microsoft Business Intelligence and Tableau. We can provide your business with a flawlessly constructed data management system thanks to our partnerships with these leading data analytics organizations in the market.

Data analytics software like Microsoft Power BI transforms disparate data sources into cohesive, immersive, and interactive data visualizations. We assist firms in implementing and maintaining their Power BI system for error-free business decision-making because we are experts in Microsoft business intelligence.

Tableau is a rapidly expanding data visualization application that translates data into clear business insights. Regardless of technical proficiency, we customize Tableau solutions to assist businesses in accelerating routine reporting and decision-making.
First, understanding your company process requires finding the best solution for you. Our team of business and technology consultants evaluates your present operations, identifies automation candidates, recommends the best RPA technologies for you, and then creates a deployment strategy.
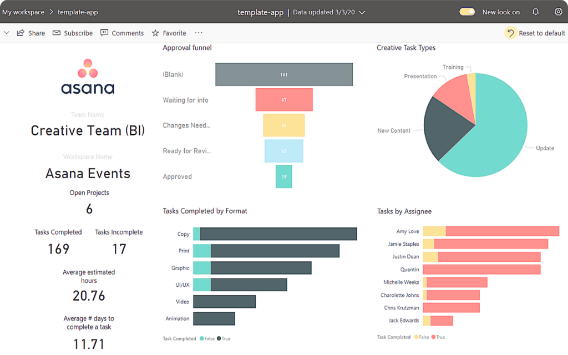
To portray their data clearly and understandably, we provide our clients with a number of graphic elements, such as charts, graphs, maps, and tables. We also make sure that these design components are simple to alter to suit changing client requirements.
Data preparation enables us to transform your inaccurate data into a format that can be precisely and quickly examined for business needs that rely on data.
Lastly, data analytics reveals helpful information that enables business owners to fully utilize their data, solve a variety of problems, predict future trends, and make decisions with certainty.
Business intelligence, or BI, gives priority to data on your company's previous and present conditions. The process of using data to generate future growth strategies and make forecasts is known as business analytics or data analytics. BI answers inquiries such as "What occurred?" and "What was the trend?" what will happen next? and "Where is the trend going?" answered by business analytics. BI and BA work together to create a complete picture of your company's past, present, and future. With this knowledge at your disposal, you can make choices that will turn your company into the knowledgeable, adaptable, and unstoppable enterprise of your dreams.
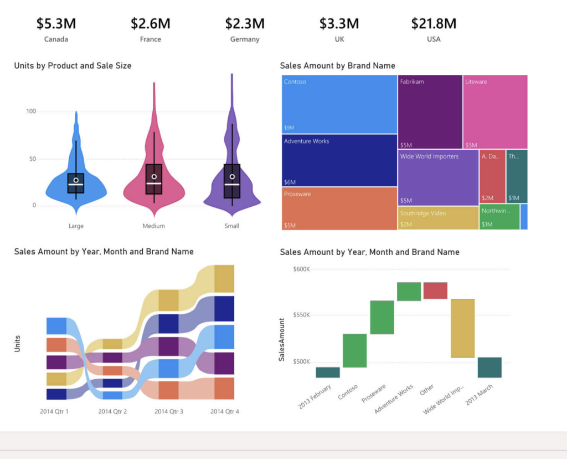

How you present your data determines how good it is. Data visualization is turning your information into visual representations that people can easily understand. Charts, graphs, and maps provide context for your data, making trends, outliers, and patterns easier to understand. Not only are visualizations able to communicate what your data means, but they also make your insights memorable for lasting impact.


The App Logy is an award-winning mobile app development company. For us, customer satisfaction is the utmost priority. Our team of experts works diligently to provide businesses with top-notch mobile app solutions to accelerate their growth. We are committed to satisfying our customers by creating powerful applications for their businesses.
Assistance hours:
Monday – Friday, 9 am to 5 pm
Phone: +1 (855) 496-7073
Email: sales@theweblogy.com
Address: 10956 South Maple Forest Way, South Jordan, UT 84095
© 2022 DBA Tekversify The Applogy All rights reserved.